This rapid study was conducted to the households from selected villages in Lawksawk Township of Shan State in 2020.
Research Team
Thein Soe, Scope Network (Lead Researcher)
Kyaw Soe Win, GMES (Member)
Thet Naing Htun, Scope Network (Member)
Sai Soe Thant, GMES (Field Collaborator)
Survey Team
Thet Naing Htun, Scope Network (Team Leader)
Myo Thet Naung, GMES (Field Coordinator)
Thazin Khine (Enumerator)
Kyi Kyi Shein (Enumerator)
Ei Mon Soe (Enumerator)
Myo Zaw Khaing (Enumerator)
Key Facts and Findings
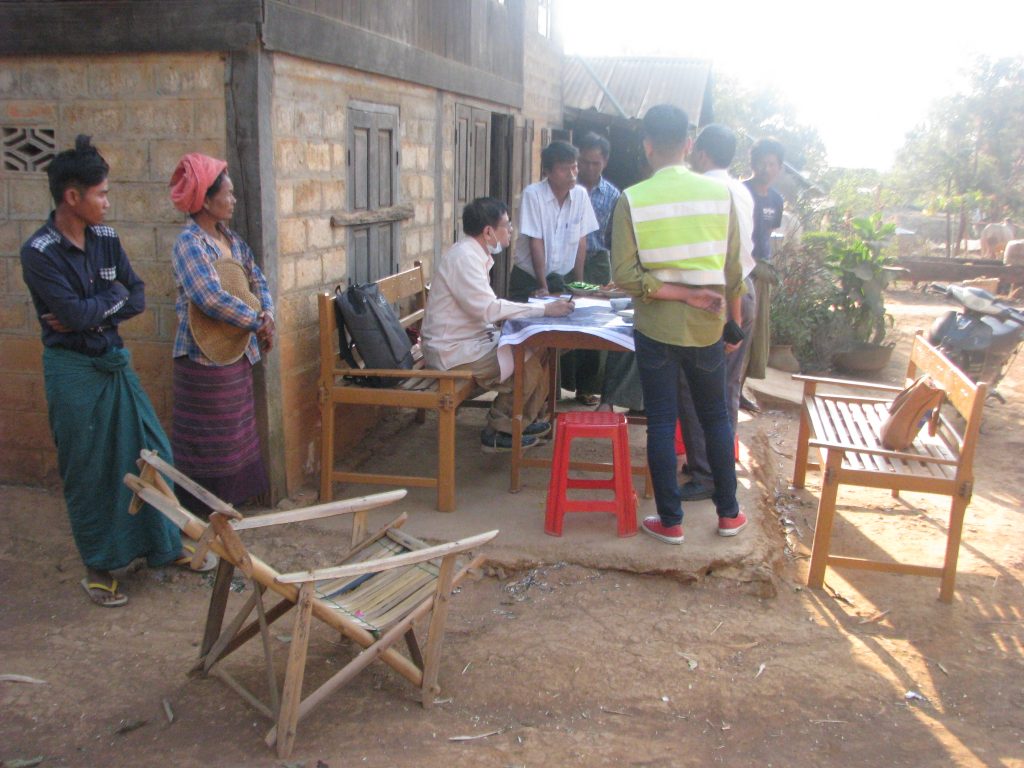
There are totally 938 households living in these six villages and the survey is successfully conducted to 131 households by using random sampling and cluster sampling methods. According to the statistical approach, the exploratory argument has a 95% chance that the real value is within ±7.95% of the surveyed value.
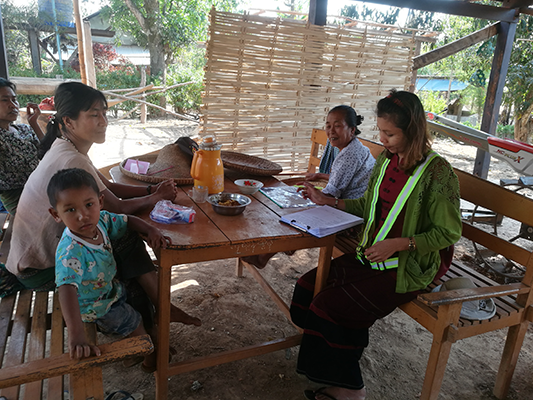
Most of the households are composed with 4 to 6 household members and gender ratio is found as 104. About 45% of the members are falling within age-range of 20 to 49 years, which is the major workforce ages for economic productivity. About 14% are falling in age-range of 14 to 19 years who may be either students or new entry into job pool including as child labors.
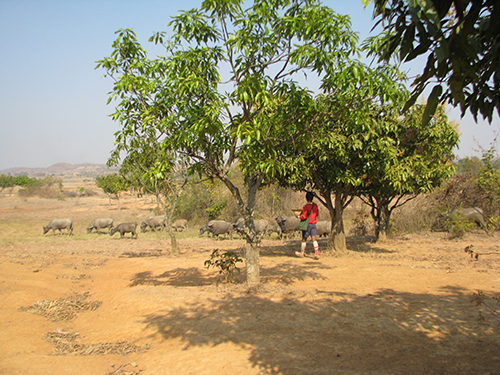
– – About 63% of the working persons are from agriculture sector and the other 18% are casual labors and working in various workplaces.
The 32.35% of these household members are working persons. For the participation of working persons according to the household members, it can be argued that in most of the households, from one-fifth to three-fifth of household members are in workplace. Among these working persons, the ratio of women participation to men is 7:10. The disguised labor shares 38.1% of working persons in which women participation is 1.4 times of men participation. In the group of working persons – who can earn certain income – the women participation is slightly less than half of the men participation. The 85% of these persons are working in the local area of Lawksawk and Shwe Nyaung, the other 5% are working in other areas of the country, and the rest 10% are working abroad. About 63% of the working persons are from agriculture sector and the other 18% are casual labors and working in various workplaces.
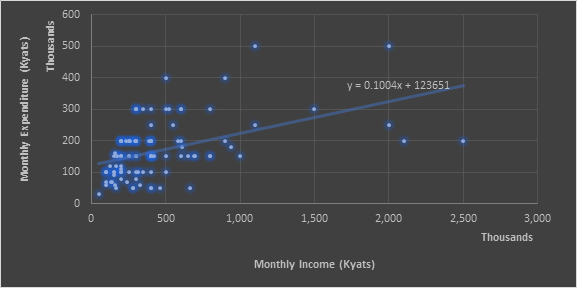
This regression model explains about 22% of all the variability in the dataset of household survey but it can be strongly confident that there is a significant linear relationship between these variables.
For every 30 households who have agriculture activities, 15 households are cultivating corn and 12 households are cultivating paddy, these two crops are main crops for the villages.
The variation of income generation by these households and their expenditure have much gaps among these households. The 89% of these households have relatively normal or low income and 85% for expenditure also. The amount of income generation of individual household does not depend on the number of both working persons and earning persons as well as the amount of expenditure does not depend on how the number of household members. It can be reasoned that a household would require to earn about 125,000 Kyats monthly as minimum for endure living in this area; not including the accommodation fee.
The sources of main income generated sectors for this area are recorded as 12 business activities and the agriculture sector shares 72.5% among them. Although the dominant economic sector of this area is agriculture, about 73% of those households are lower or lowest income households relatively among the area. The 88% of households hold the land of either cultivated plots or horticulture; some of them do not operate agriculture activities themselves and they hire their land-plots to other farmers. About 4% of households who operate agriculture activities by renting land-plots totally from others and the rest 8% also rent although they hold some land-plots. These households are cultivating or planting the corn, paddy, pigeon pea, gram pea, garlic, sugarcane, watermelon and mango. For every 30 households who have agriculture activities, 15 households are cultivating corn and 12 households are cultivating paddy, these two crops are main crops for the villages.
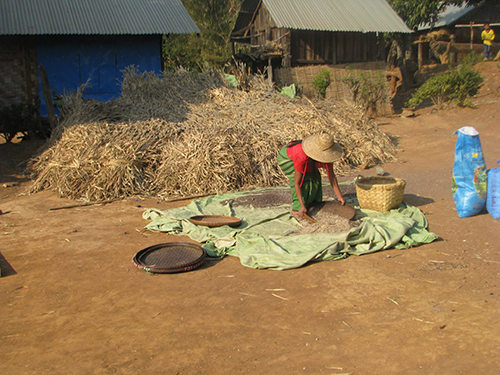


It can be estimated that a farmer would require to input 140,000 Kyats to 200,000 Kyats to cultivate the corn and require 150,000 Kyats to 250,000 Kyats for paddy cultivation per acre as minimum scheme. About 38% of households who have agriculture activities input the required capital with self-financing scheme. The other 62% of households depend on loan/credit – either fully or partially – from the various sources of formal and informal creditors. Among these 131 households, households just under 3% have the practice of saving at banks.
Lighting
:: 3 out of 10 households use electricity
:: 7 out of 10 households use home solar power
:: 11 out of 50 households use battery bulb
Cooking
:: 10 out of 40households use electricity
:: 4 out of 5 households use firewood
:: 1 out of 25 households use charcoal
For every 100 households
:: 17 households have purchasing purified water for drinking, in which some households use other water sources for drinking also
:: For water from tube-wells, 56 households use as drinking and 68 households use as domestic purpose
:: For water from ponds, 4 households use as drinking and 6 households use as domestic purpose
:: For water from natural springs, 22 households use as drinking and 26 households use as domestic purpose
:: One household use rain harvesting for drinking and 5 households use as domestic purpose
:: 9 out of 10 households use mobile-phones
:: 15 out of 20 households possess motorbikes
:: 3 out of 20 households possess bicycle
:: 7 out of 10 households have televisions
:: 5 out of 20 households have radios
:: 9 out of 50 households have EVD/DVD players
:: 7 out of 50 households install satellite receivers
:: 7 out of 25 households own tractors or trailers (Htawlargyi)
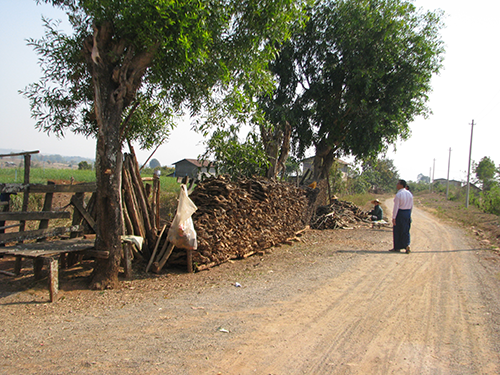
Some households collect firewood or make charcoal themselves and so these households do not have any explicit cost for cooking-fuel.
5 thoughts on “Exploring the socio-economic conditions of rural communities”
It would be good if we can classify LIVILIHOOD by key factors. Incomes, purchasing power, mobile application, property ownership, etc, It’s not an easy job but but if you can formulate by previous survey data and experience. We should be able to say what is the livelihood status. Like we are comparing water and quantity standard, we can establish livelihood standards. WB, ADB, JICA have defined poverty level only in their social survey approach.
This time I can not attend the seminar as I have a personal appointment. See you when we both are convenient.
Dear Ko Soe Min,
Thanks for your thought upon our research.
Now I added new paragraph about the income classification relatively among these households. I hope you may satisfy for that and can explore their comparative livelihood.
I’m not sure where you’re getting your information, but great topic.
I must spend a while studying more or working out more.
Thanks for great information I used to be searching for this info for
my mission.
If you want to know more in details, please feel free to contact me.
Thanks for your reach out.
If you want to know more in details, please feel free to contact me.
Thanks for your reach out.